CO2 and CH4 Measurement
General
Since 1999, the climate-impacting trace gas CO2 has been measured at the Sonnblick Observatory by the Federal Environment Agency. Due to the remote location, the global change in CO2 concentration can be inferred from the measurements at Mt. Hoher Sonnblick. In 2012, the measurements at Sonnblick could be extended to include CH4.
Diagram 1 shows the development of the CO2concentration measured at Sonnblick Observatory updated monthly. The monthly values averaged from minute-by-minute measurements show the known annual cycles superimposed on the current trend. This so-called annual cycle is caused by seasonal sources or sinks - e.g. vegetation is a strong sink for CO2 with predominant effect in the summer months. Because of these natural seasonal variations, minimal changes in the trend are difficult to detect. In any case, it should be noted that August 2017 was the last time a CO2 monthly mean (399.51 ppm) below 400 ppm was measured at Sonnblick.
Diagram 2 shows the continuously updated mean concentration of CH4 since the beginning of measurements in 2012.
CO2 Trend
In order to be able to detect even the smallest changes in the current trend despite the seasonal fluctuations, the average annual trend for the years 2001 to 2016 was first determined (Diagram 4), in order to be able to use this to adjust the measured monthly mean values for the proportion of the annual trend, i.e. the measured monthly mean values are reduced or increased by the proportion shown in Diagram 4 (red dots) for the respective month.
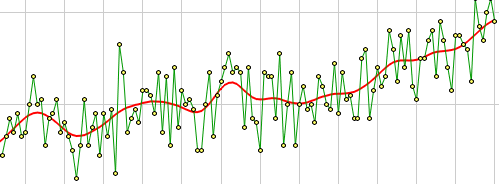
This results in the monthly mean values of the CO2 concentration shown in diagram 3 (adjusted for the annual cycle), which follow an average increase of 2.08 ppm per year (linear regression) in the period 2001 to 2016 (reference period). In addition, polynomial regression (solid red line) is used to visualize short-term changes in the long-term trend.
The Paris Agreement calls for limiting the global temperature increase to well below 2 °C by the end of this century compared to pre-industrial times, with an increase to a maximum of 1.5 °C being targeted. A 2 °C increase in global average temperature is seen as likely to be avoidable if CO2 equivalent concentrations are at a maximum of 450 ppm in 2100. The "CO2 - equivalent" is calculated by calculating and cumulating the specific contributions of different greenhouse gases (CO2, CH4, N2O, SF6, etc.) as if they were additional CO2 contributions (source: IPCC Climate Change 2014 - Synthesis Report).
In 2023, this sum was 534 ppm CO2 - equivalent (source: NOAA/ESRL), so the target of 450 ppm is currently significantly exceeded. According to climate models, exceeding the long-term target can be tolerated if global greenhouse gas emissions can be significantly reduced by the end of this century (-40% to -70% by 2050 or -100% by 2100 compared to emissions in 2010) and the 450 ppm CO2 - equivalence can be undershot again.
Diagram 1
Diagram 2
Diagram 3
Diagram 4
Diagram 5
Diagram 6
Diagram 7
Diagram 8
Measuring principle
The measurement series of CO2 was started with a Hartmann&Braun URAS 3G, the reference gases were measured at the Schauinsland station and used for calibration three times a day. The measurement principle of the instrument was based on the infrared absorption of CO2. Since 2012 a modern Picarro CRDS using calibration gases from EMPA is in use, the instrument determines both CO2 and CH4 concentration by laser spectroscopy in an optical resonator.
Contact
![]()
GeoSphere Austria - Sonnblick Observatory
Gerhard Schauer
Akademiestraße 39
5020 Salzburg