Forest fires & volcanic eruptions - A review of the year 2021
In the summer months of 2021, a number of forest fires were registered in Europe.
Areas in Italy, France, Greece and Turkey were hardest hit by large fires. In order to investigate the transport of carbon monoxide (CO) to the Sonnblick, the period 15.7. simulated with the WRF-Chem model including forest fire emissions from IS4FIRES (FMI) until August 31, 2021. No other emission sources and no background exposure were used in this simulation to ensure that the simulated CO is solely due to transport from forest fire areas.
Fig.1 shows the modeled CO column values and the CO measurements at Sonnblick. The CO measurements show fluctuations between approx. 100 and 200 µg/m³. On 20.7. the measurement shows a significant increase and remains at a constantly high level until the end of July, which roughly corresponds to the first forest fire episode (July 25th - 28th, 2021) detected by the model simulation. In the second forest fire episode detected by the model (13.8. to 23.8.) the CO measurements show some peaks.
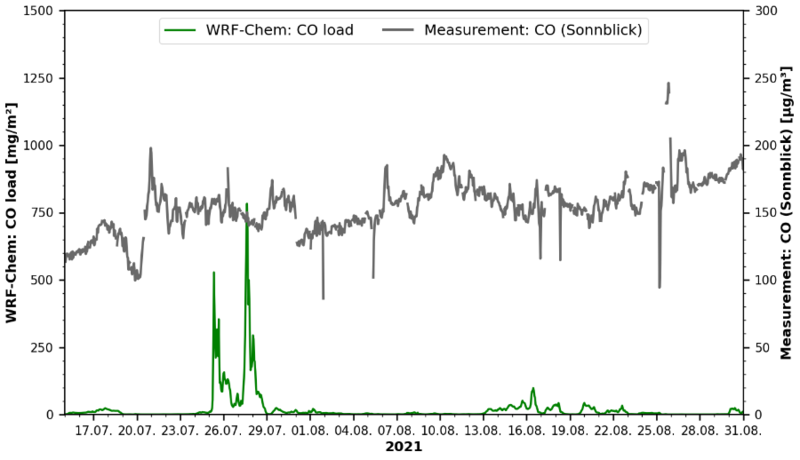
Figure 1: CO modeling and measurements
A major forest and wildfire broke out on July 24, 2021 on the Mediterranean island of Sardinia. Due to the strong sirocco, the fire spread quickly and made extinguishing work more difficult. More than 20,000 hectares were affected by the fire.
The FLEXPART QRS field (Fig. 2) indicates an area of origin of the air from the Mediterranean region for this time. The WRF-Chem simulation (Fig. 3) also clearly shows the transport of CO from the forest fire in Sardinia towards Austria.
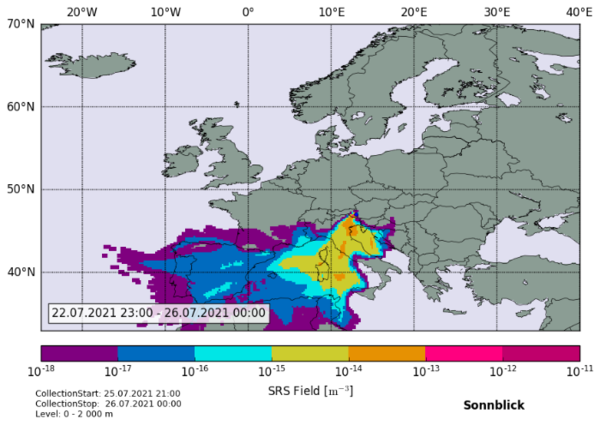 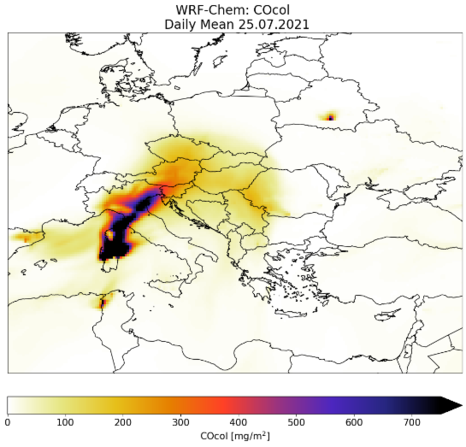 |
Figure 2: FLEXPART QRS-field Figure 3: WRF-Chem simulation
Etna volcano was very active in February 2021, with particularly violent eruptions including eruptions of ash and gas on 18.02.2021 and 22.02.2021. Since December 2020, increased ash ejections and small lava flows have been observed on Etna.
On February, 25.2. and February 26, 2021 increased SO2 concentrations were measured at the Sonnblick Observatory.
The maximum value was around 10 ppb (see Fig. 4)
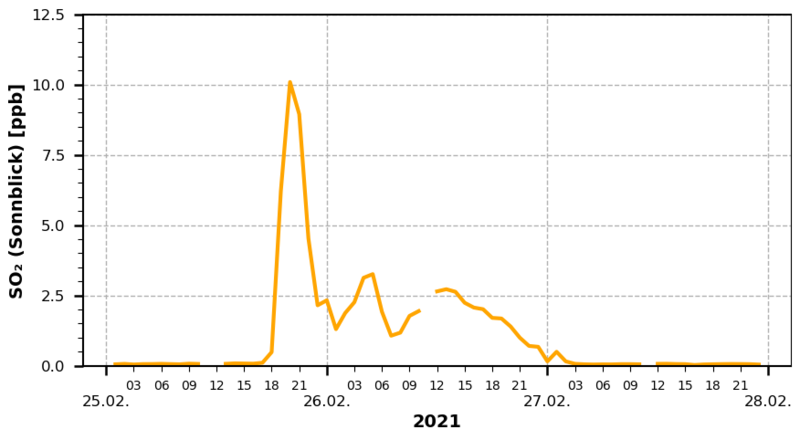
Figure 4: SO2 values at Sonnblick Observatory
The transport of the SO2 cloud towards Central Europe is also measured by the TROPOMI instrument on the Sentinel-5P (ESA) satellite. The satellite image shows the increased SO2 column values in the area of the volcano and the transport of the SO2 cloud towards the north (Fig. 5).
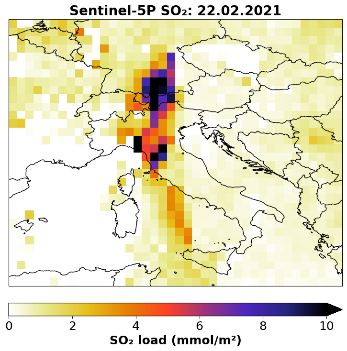
Figure 5: SO2 column TROPOMI/Sentinel-5P
The FLEXPART QRS field can be used to prove whether the SO2 values measured at Sonnblick can actually be traced back to the volcanic cloud. The QRS field clearly shows that a contribution from the incoming air above the boundary layer (more than 2 km above ground) can be traced back to a source area in the area of Sicily (Fig. 6).
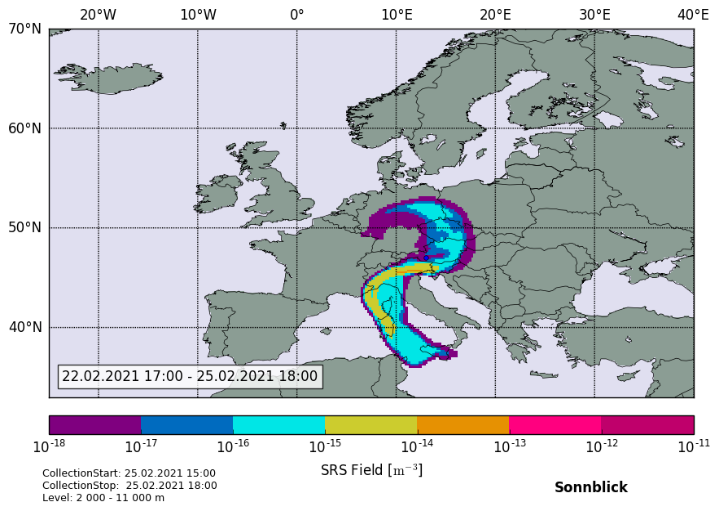
Figure 6: Flexpart QRS-field
In addition to the Etna eruption, a transport of desert dust towards Austria was also observed during this period. Increased backscatter intensity due to aerosol-rich air, which can be attributed to ash ejection from Etna volcano, cannot be optically separated from the signal of the Saharan dust cloud in the ceilometer measurements. The assignment can only be based on the time when the individual signals occur. However, with the help of the FLEXPART QRS field and the WRF-Chem dust forecasts, as well as the activity of the volcano over the time, the sources can be assigned in the ceilometer backscatter profiles (Fig. 7).
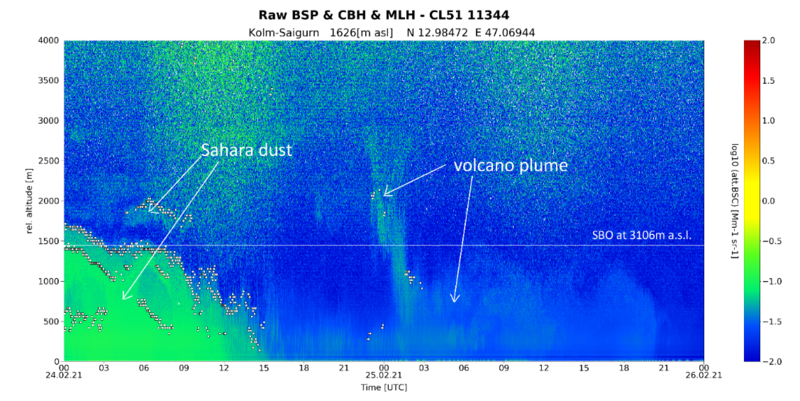
Figure7: Backscatter profile ceilometer Kolm-Saigurn